PetSafe Brands
Leading a fast UX assessment to turn mobile purchase friction into a conversion-focused roadmap.
I led a 6-week UX assessment for four PetSafe DTC brands: we identified friction in the mobile purchase funnel and translated it into a clear roadmap for improving conversion.
Company
PetSafe Brands
Industry
E-commerce / DTC / Consumer products
Role
UX Lead Designer
Product type
Mobile e-commerce / PDP / Purchase funnel
Timeline
Nov 2025 – Dec 2025
Team
UX Lead, UX Designer, Client Stakeholders, Analytics, Business, Product
Methods
UX Assessment, Heuristic Evaluation, Benchmark, Journey Mapping, Analytics Review, Wireframes, Prototyping, Strategic Roadmap, Executive Storytelling
Tools
Figma, FigJam, Gemini, Google Analytics, Miro, Slides / Presentation tools
Status
Delivered assessment / Roadmap for implementation
Confidentiality
Part of this project is under NDA: sensitive analytics and brand-specific findings are blurred or simplified. I'm happy to share more detail in an interview or portfolio review.
Context
PetSafe Brands needed a strategic UX assessment across four DTC brands to understand why users were dropping off in the mobile purchase funnel, especially around the Product Detail Page and decision-making moments before checkout.
The timeline was very compressed: we had to understand several brands fast, review qualitative and quantitative signals, and deliver a roadmap that could feed the next implementation phase.
Why it mattered
The hard job was tying UX friction to the KPIs that mattered here (conversion and revenue) and getting stakeholders to agree on what to change, why, and in what order across four different brands.
My role
I worked as UX Lead Designer, leading the assessment strategy to move from discovery to actionable recommendations in six weeks.
- Coordinated the audit of the mobile purchase funnel, focused on the PDP and decision support.
- Structured the benchmark approach across brands and competitors.
- Helped connect qualitative findings, analytics signals, and UX heuristics into a clear diagnosis.
- Reframed the project narrative after critical feedback into a stronger sequence: qualitative discovery, quantitative definition, and expert design.
- Built the final assessment storytelling to connect user friction with business impact.
The challenge
The challenge was diagnosing conversion friction across several mobile experiences in very little time, while aligning stakeholders around an evidence-based roadmap.
- User challenge: users needed clearer product information and a smoother PDP to buy with confidence.
- Business challenge: PetSafe was looking for UX opportunities to raise conversion from 1.01% to 2.19% across its four brands.
- Design challenge: a lot of information and complex analytics had to become a simple executive story, fast.
Problem statement
How might we help mobile shoppers decide more clearly, while identifying UX improvements that support conversion growth?
Goals & success criteria
User goals
- Understand product value and purchase options clearly.
- Reduce friction on the PDP and at key decision moments.
Business goals
- Support the goal of moving conversion from 1.01% to 2.19%.
- Create a roadmap that could unlock the next implementation phase.
Design goals
- Build a clear diagnosis of the PDP and the purchase funnel.
- Combine heuristic evaluation, benchmark, analytics review, and stakeholder input.
- Tell the findings in a way executives could act on.
Process
01 — Discover
Understanding the funnel, the brands, and the conversion problem
With such a short timeline, discovery had to be focused from the start: the four brands, the mobile purchase journey, and the concern around conversion.
- Reviewed the mobile purchase funnel, paying attention to the PDP and decision moments.
- Coordinated a benchmark strategy for each brand and relevant competitors.
- Reviewed analytics signals to understand where users were dropping off.
- Identified recurring friction patterns in navigation, product information, and trust.
How I used AI
I used Gemini as a project space to organize client inputs, workshop notes, and per-brand analysis, and to identify what to review on each site. The final conclusions were mine, based on UX judgment and stakeholder feedback.
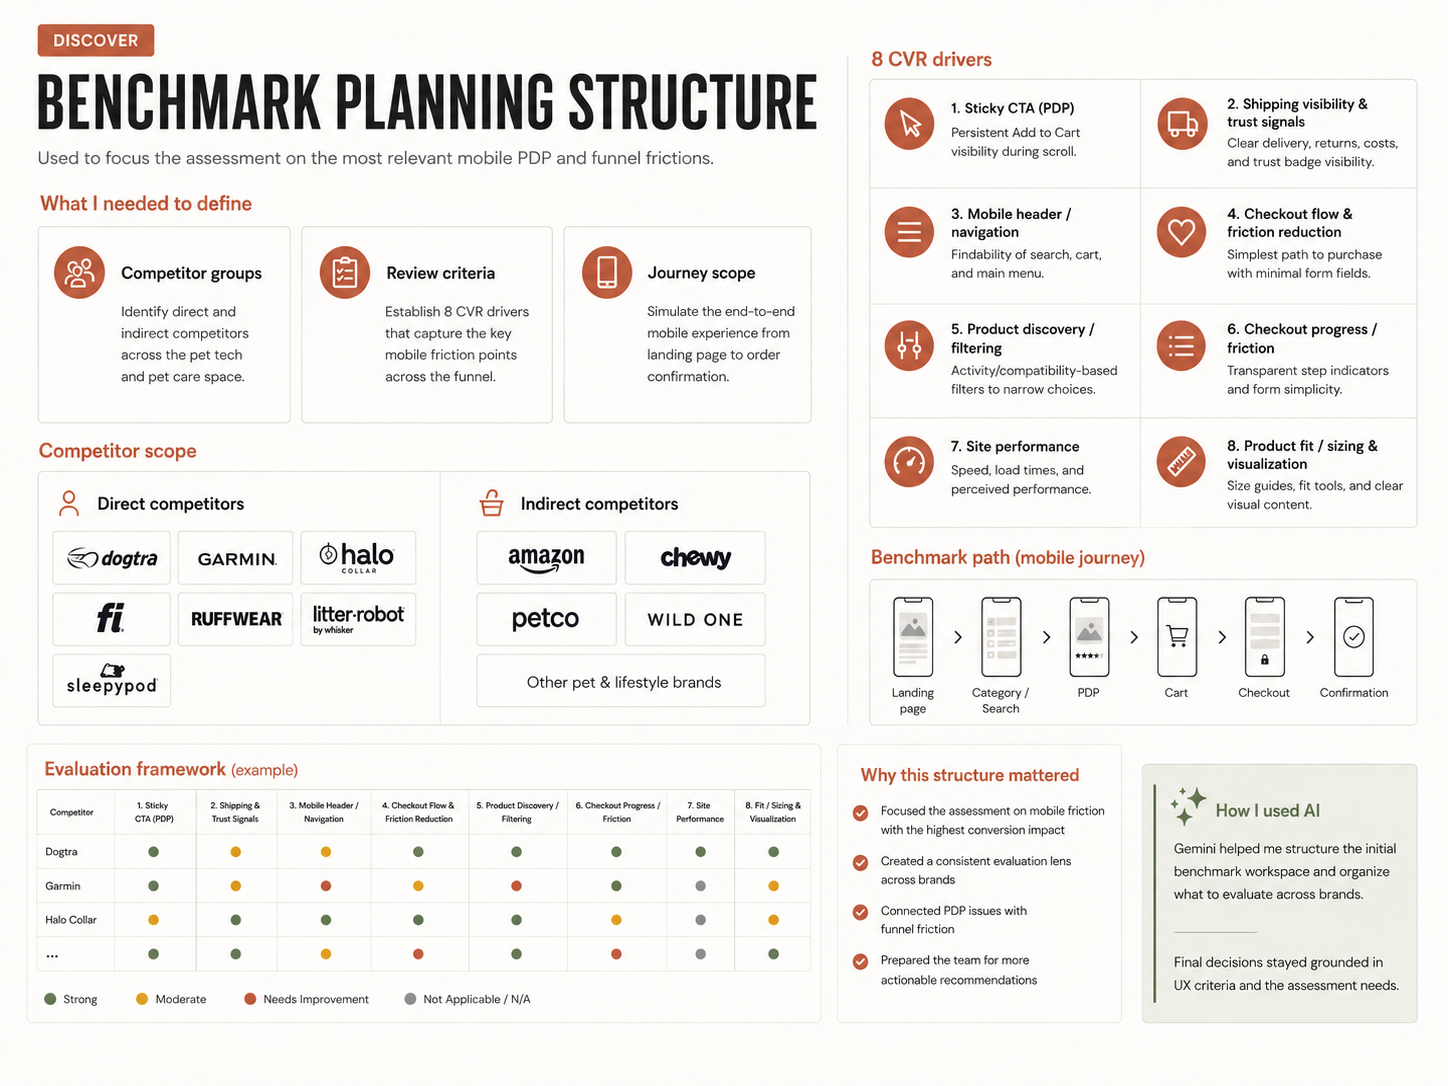
Benchmark planning structure used to focus the assessment on the most relevant mobile PDP and funnel frictions.
02 — Define
Turning scattered findings into a clear diagnosis
Then I organized the findings to avoid a long list of disconnected observations and build a diagnosis that connected friction, analytics, and business impact.
- Connected qualitative observations with analytics signals from the purchase funnel.
- Prioritized problems by impact, conversion relevance, and feasibility.
- Reframed the narrative after critical feedback: qualitative discovery, quantitative definition, and expert design.
How I used AI
I used Gemini to synthesize across brands and organize the patterns into themes.
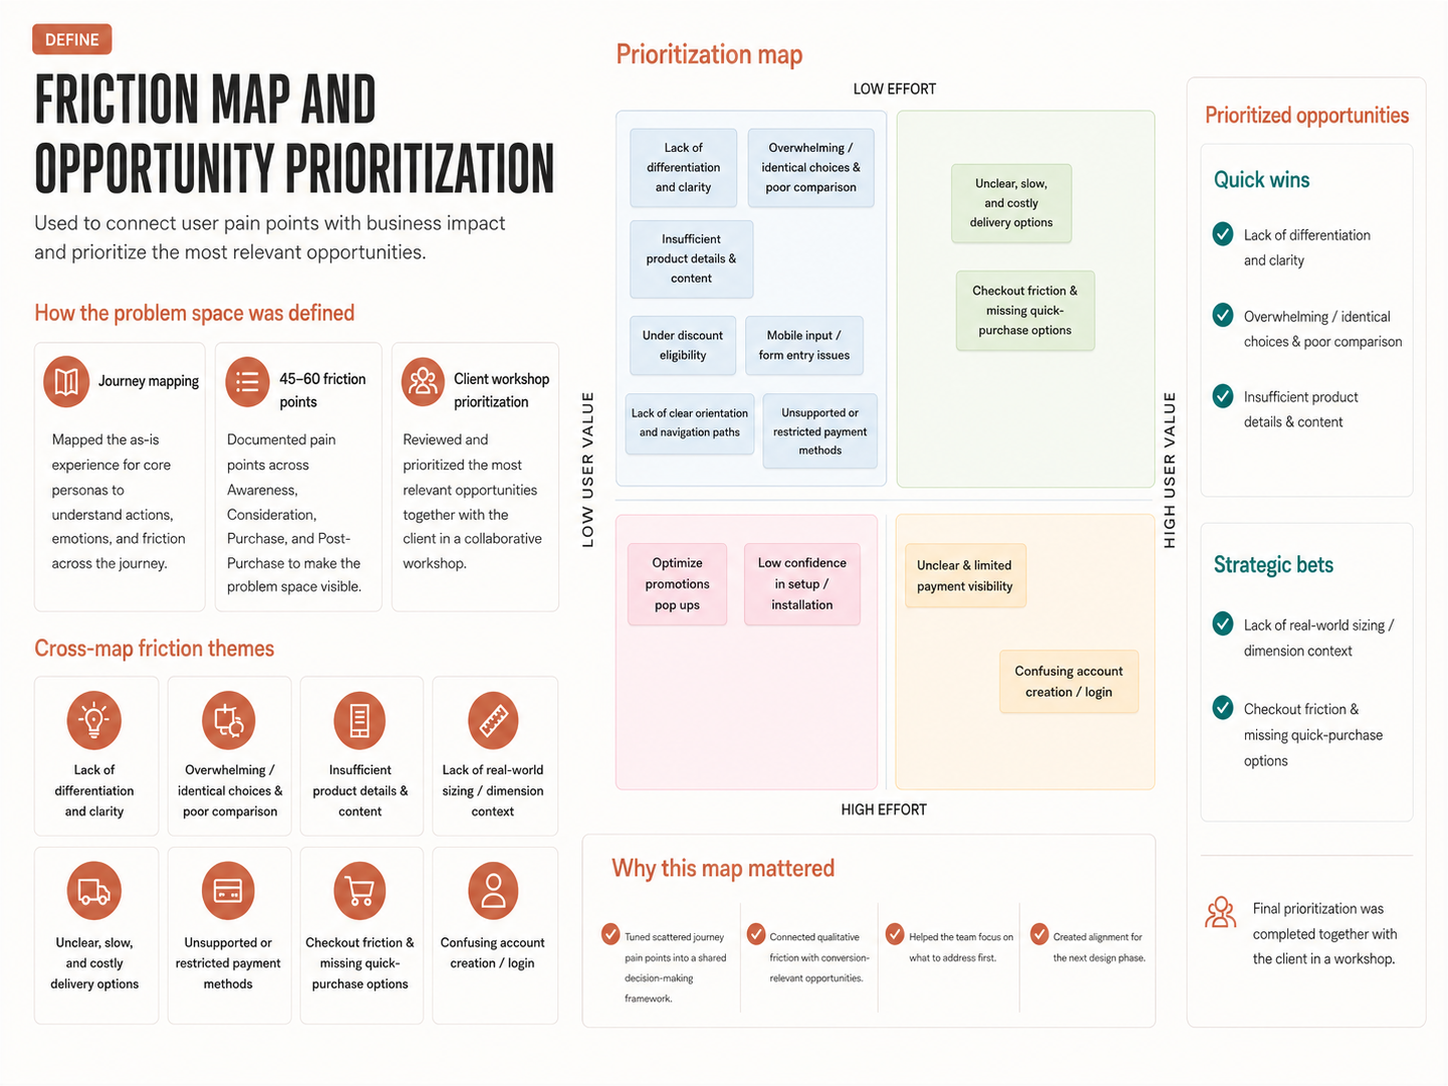
Friction map used to connect user pain points with business impact and prioritize the most relevant opportunities.
03 — Develop
Exploring UX recommendations and conversion-focused improvements
With the diagnosis clear, I translated the opportunity areas into recommendations and wireframes. The focus was on the changes with the most effect on clarity and confidence in the purchase journey, not on redesigning everything.
- Explored improvements to PDP structure, content hierarchy, and decision support.
- Created wireframes and prototypes to communicate recommended changes.
- Balanced quick wins with broader roadmap opportunities.
How I used AI
I used Gemini to generate visual and structural ideas for the PDP from the assessment findings.
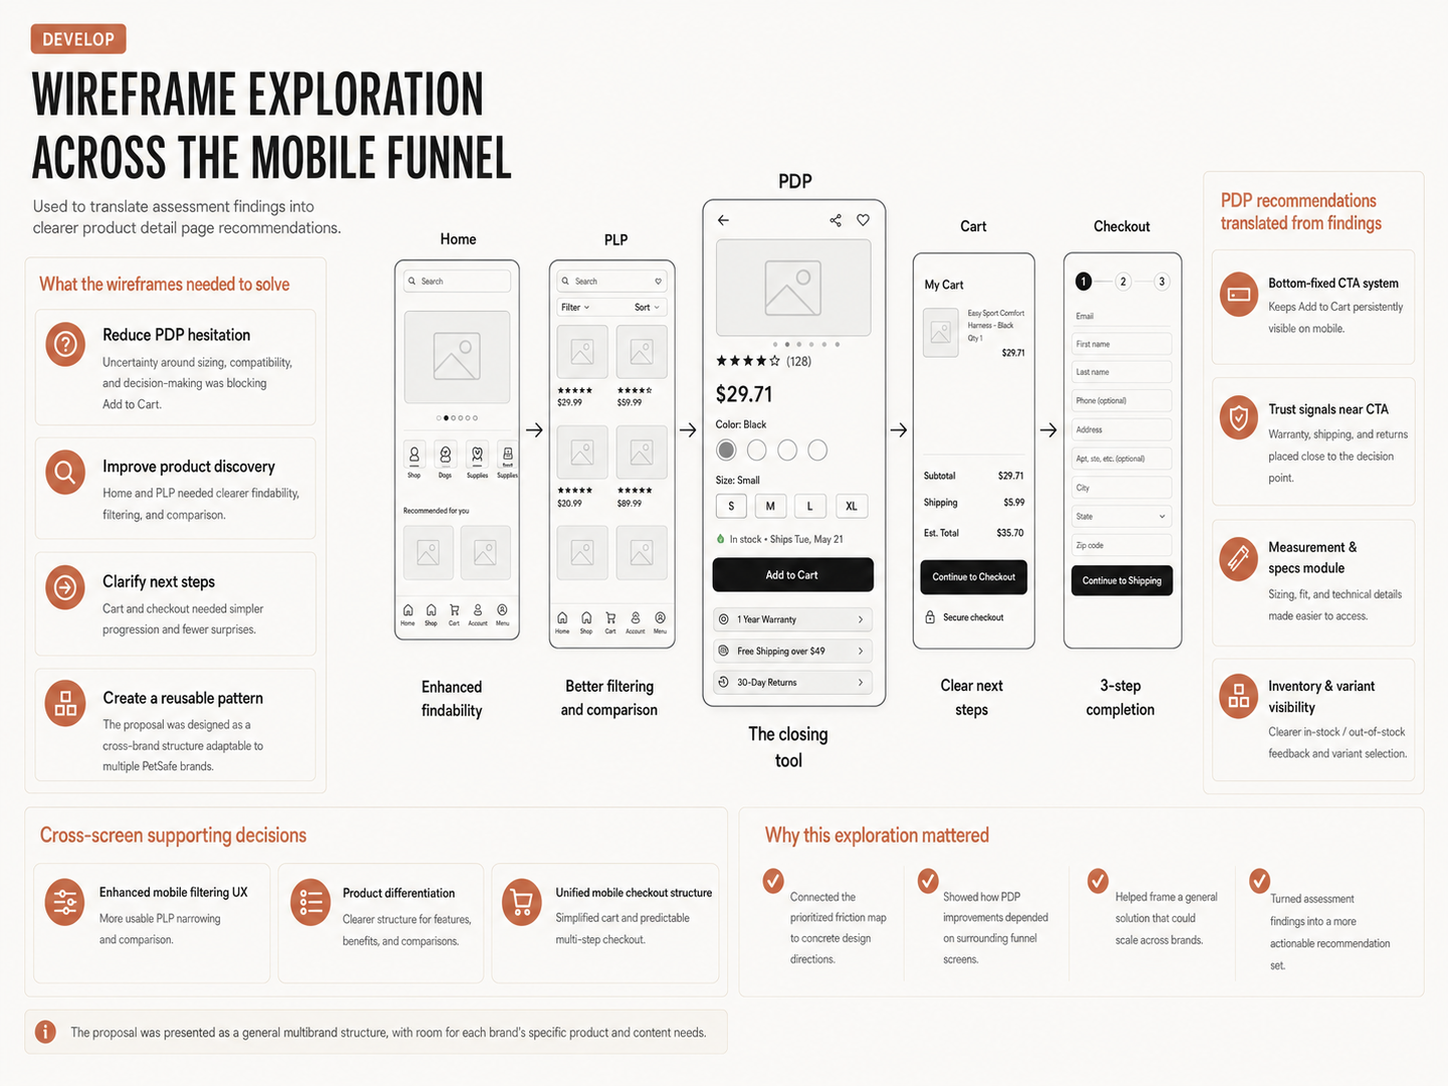
Wireframe exploration used to translate assessment findings into clearer product detail page recommendations.
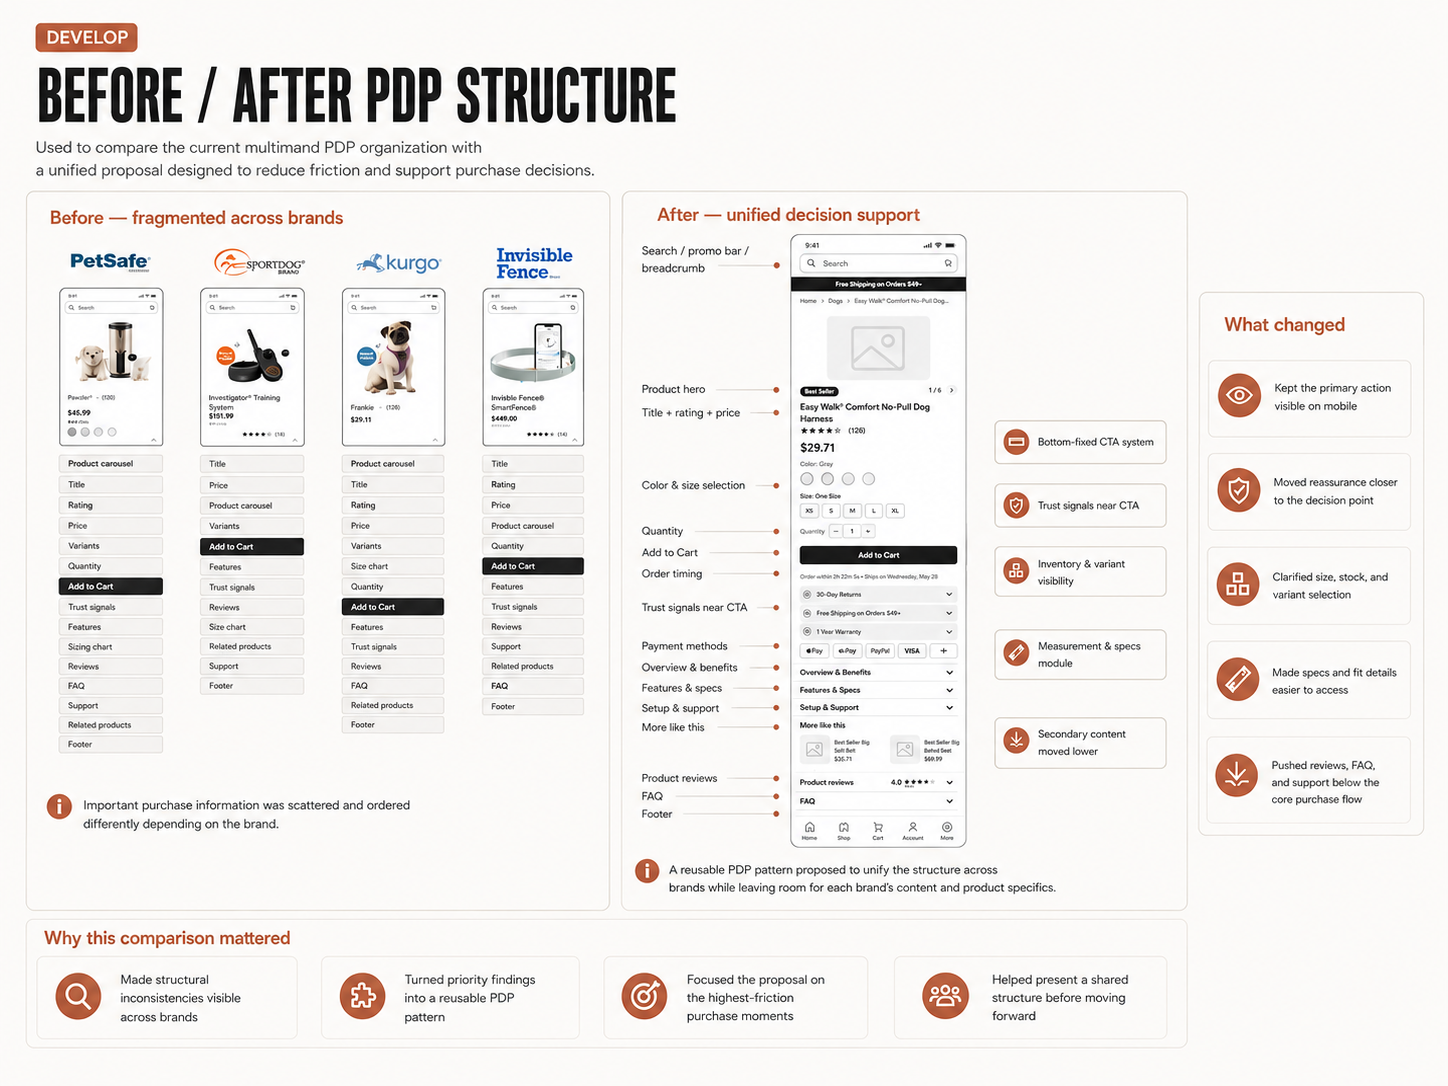
Before / after structure showing how product information could be reorganized to reduce friction and support purchase decisions.
04 — Deliver
Delivering a roadmap that connected UX with business
The final deliverable was a report that translated research, analytics, and benchmark into a clear roadmap, built so stakeholders understood what to change and why it mattered for conversion.
- Delivered the assessment report for the four DTC brands.
- Presented a roadmap focused on the mobile funnel and the PDP.
- Helped show how UX improvements could contribute to moving conversion from 1.01% to 2.19%.
How I used AI
I used Gemini to structure the final executive storytelling, especially valuable on such a short timeline.
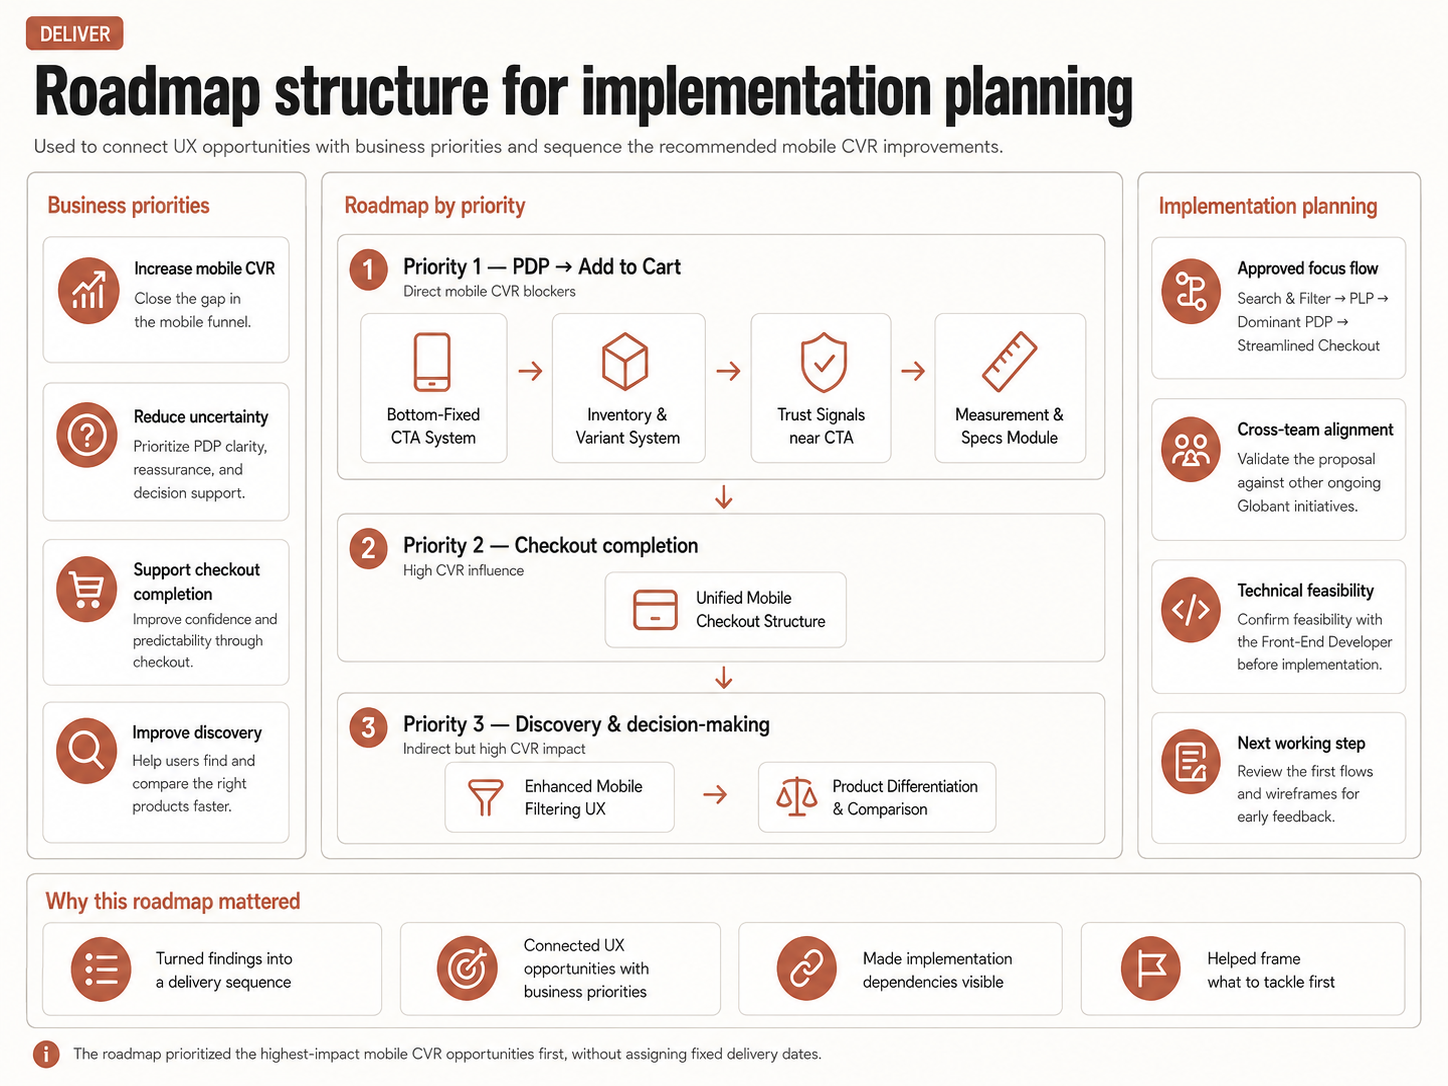
Roadmap structure used to connect UX opportunities with business priorities and implementation planning.
Before / after
Before
Friction points that were hard to prioritize across four brands, with findings and analytics signals lacking an actionable structure.
After
A conversion-focused roadmap that connected qualitative findings, analytics, and benchmark for the next phase.
Final solution
The proposal focused on three improvements:
A clearer mobile PDP experience
Better hierarchy, trust cues, and decision support, so users understood what they were buying.
A stronger conversion-focused diagnosis
The diagnosis connected qualitative friction, analytics, and benchmark to show which problems weighed most on conversion.
A strategic roadmap for implementation
A roadmap that helped the client move from diagnosis to action with clear priorities.
Impact & results
User value
Identified PDP and funnel frictions that hurt product understanding and purchase confidence.
Business value
Delivered UX recommendations aimed at growing conversion from 1.01% to 2.19%.
Product value
A roadmap of prioritized improvements for the four DTC brands.
Team / process value
From scattered findings to an executive story that unlocked alignment for implementation.
Obstacles & trade-offs
With such a short timeline, the assessment had to stay focused on the highest-impact areas, trading depth where it mattered less.
- Working across four brands in only six weeks.
- Connecting qualitative findings with analytics without overcomplicating the story.
- Reframing the project narrative after critical feedback.
- Working in English and landing a clear, persuasive final presentation.
What I learned
Finding problems is the easy half of UX leadership; the hard half is helping the team see which ones matter and what to do about them.
- I learned to lead a UX assessment under strong time pressure.
- Connecting UX findings to KPIs like conversion and revenue is what makes an assessment actionable.
- Storytelling matters as much as the analysis when presenting complex findings.
- A strong roadmap is a decision-making tool, not a list of recommendations.
Six weeks, four brands, and a lot of ambiguity to lead through. PetSafe is a good example of how I connect UX findings to business goals under pressure, using AI to move faster where it helps, and turning a messy assessment into a roadmap the team could actually act on.
Stephanie Cacheo — Senior Product Designer / UX Lead